Basic Concepts (Part 1)
User mode vs. kernel mode
When a user mode thread wants to perform an operation, what it wants to do is transmitted from user mode to kernel mode, and then kernel mode processes the request and sends it back to user mode.
User mode
- There is no access to hardware
- Each user application here has its own process space, so when it crashes, only it is affected, not the system
- Only allows access to non-operating system codes and data
Kernel Mode
- Privileged mode for use only by the kernel and device drivers
- Access to all system resources
- Potential to affect the entire system when it crashes
Process
Processes are objects that manage the resources of a program to be run. Processes do not run. The things that run are the threads owned by the processes. For a process, it can simply be referred to as a manager.
What a Process Contains
- Virtual Address Space, the memory a program owns.
- A piece of code needed to run. An example of this is main(). This function runs first when the program is run.
- Handles of a variety of different kernel objects.
- If I open a file, I use an API. The API is simply a function in the form of a file. If this API is successful, it returns a handle.
A handle is a numerical value found in a specific process’s table.
- The tasks that processes can do are limited. It is automatically prevented from happening to other processes. For example, let a process have a bad pointer and this pointer points nowhere. Since this pointer points nowhere, the process may crash. But other processes will not be affected.
- Security Context(access token), allows security checks for shared resources. If we want to access a process directly, this becomes invalid due to the security context.
- There are threads in a process that serve to run the codes in the process. The first thread always runs the main function.
In short, processes are hosts that contain various data types and allow threads to run the codes in the process.
What is Not Responding
Windows expects a running program to “interact” with it and respond to its requests in a timely manner. If you click on the Close Program “X” in a program’s window and the program does not confirm this, it means it is “not responding”.
There are some reasons for this situation. These are;
- For example, if the program you are using is doing a very long, CPU-intensive calculation, it may not respond in time.
- For example, if a video editing program performing some operations on a large video, if you try to close the window during the operation or calculation and nothing happens, Windows may eventually add “(Not Responding)” to the title bar. Windows is trying to convey your request to the application, but the application is not listening.
Even though the program not responding while doing long calculations is a bad thing, windows allows this. When the calculation is completed, the program starts to listen and respond again.
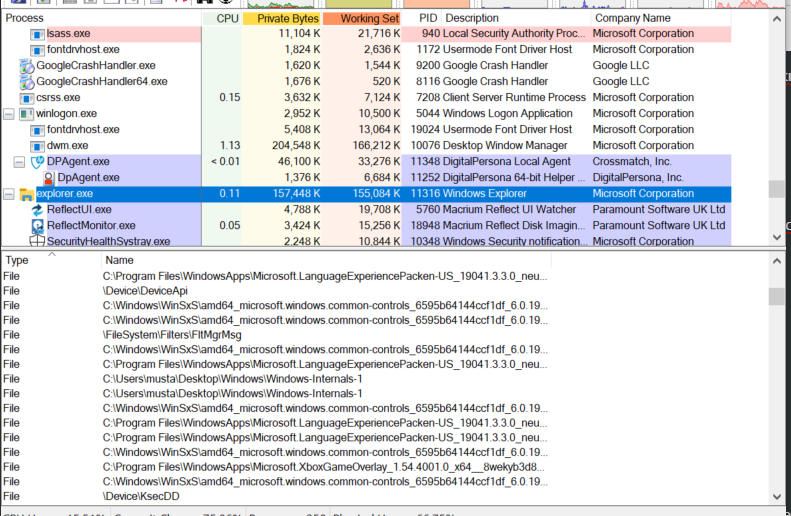
Examining Process with Task Manager
Now let’s open 2 notepads and see what differences are there and what’s going on in the background
In Task Manager, to be able to see the number of threads etc. and a lot of information, come to the top row (Name, PID, Status, User Name..) and right click and select the Select Columns option to learn more about the processes.

- As seen here, the two notepads have different PID(Process ID)s, different memory sizes, different Threads, etc.
- This happens because opening 2 notepads opens 2 different processes.
- In the status section, there is another part that says
Running. This part tells us not that notepad is running something, but on the contrary, it is ready to receive an input or something.
Sometimes a process can go into a Not Responding state. In this state, the process becomes unable to perform any operation. This situation arises in 2 ways:
- If the process is using too much CPU
- If it is doing nothing but waiting for an I/O operation
Process Explorer
Section Color

When we come to the Options→Configure Colors tab from Procexp, we are greeted by the image below
In this image, the colors of the processes according to their types are seen. We will revisit this part later.
Highlight Duration
Again, when we come to Options→Difference Highlight Duration, the window that opens shows us the refresh time of procexp.
Lower Pane(Split View)
When we click on any process and then

When we click the button seen in the middle of the picture, we are greeted by such a screen.
This screen gives us 2 different information about the selected process. These are;
- The first one, as seen in the picture above, shows the dll’s included in the selected process.
- The second one appears when the button to the right of the first button we pressed is pressed. The new information that emerges shows us the handle values that the process hosts.
Threads
Threads are entities used to run a code over the kernel.
What They Contain
- They contain the current states of CPU registers.
- Current Access Mode(user mode or kernel mode)
- They have 2 different stacks. One of them is in user space and the other is in kernel space.
- A special storage area called Thread Local Storage(TLS).
- Optional security token
- Priority, a number used for thread timing. This number is from 0 to 31. 31 is the highest priority.
- If the thread creates one or more windows, a message loop must be provided; this message loop takes messages from the thread’s message queue and sends them to the appropriate window procedures.
- Threads have statuses. These are:
- Running: The thread has started and has not yet been stopped.
- Ready: This status arises when the thread wants to run but the turn has not come to this thread because all other cores are running other threads.
- Waiting: The thread is not running. Because the thread is waiting for something (a signal or anything).
Examining Thread with ProcExp
We click on any thread with Procexp and right click and say properties. After selecting the Properties option, we click on the Threads part. In this example, the selected process is Notion.
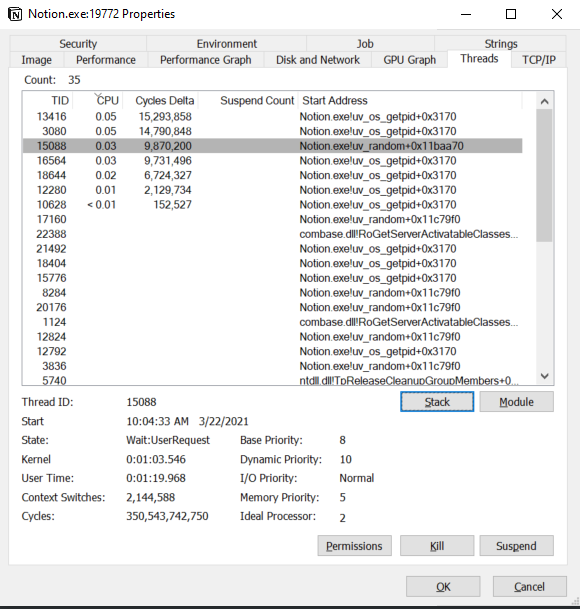
The TID value seen on the right here represents the Thread id. Thread ID and Process ID come from the same pool. Therefore, a thread id or process id is only found in itself. That id is not seen in any other thread or process.
Start Address: The start address shown here shows where the specified thread started to run.
If we click on any thread here and click the Stack button.


The stack here is from user mode to kernel mode. For example, while examples are taken from Notion.exe in the picture above, various things are taken from ntoskrnl.exe(kernel mode) in the picture below.