From Userland to Kernel: Deep Dive into SYSCALLs using WinDbg and Binary Patching

What?
In this article, we will embark on a fascinating journey into the intricate world of Windows system calls. Our exploration is divided into two major segments: User-Side and Kernel-Side.
User-Side
Writing User-Mode Code: We begin our expedition by crafting a simple yet powerful C++ program designed to interact with the Windows kernel through system calls. We’ll introduce you to the essential concepts and tools needed to dissect user-mode code.
Analyzing User-Mode Code: With the assistance of the IDA disassembler and debugger, we delve into the inner workings of our user-mode program. We’ll break down the steps involved in locating the main function, setting breakpoints, and tracing the code execution, revealing how user-mode code interfaces with the Windows kernel via syscalls.
Kernel-Side
Understanding the Kernel: In this segment, we take a deep dive into the Windows kernel. We’ll attach a kernel debugger to a guest operating system, providing insights into how syscalls are processed within the kernel.
Implementing Kernel Traps: We’ll show you how to set up a trap within the kernel to capture specific syscall conditions, allowing us to gain control over the kernel’s execution at critical points.
Through practical code examples, vivid explanations, and the use of debugging tools, we will demystify the journey of a system call from user mode to kernel mode. By the end of this article, you’ll have a solid understanding of how Windows syscalls work and the tools and techniques to explore them further. So, join us on this captivating adventure into the depths of Windows system calls!
User-Side
Writing User-Mode Code
We kick off our journey into the realm of system calls with a straightforward C++ program that we’ve designed for this purpose. Here’s the code snippet:
1
2
3
4
5
6
7
8
9
#include <iostream>
#include <Windows.h>

int main()
{
    HANDLE h = CreateEvent(NULL, FALSE, FALSE, NULL);
    WaitForSingleObject(h, INFINITE);
    CloseHandle(h);
}
At first glance, this code seems to make a call to the familiar WaitForSingleObject function, a part of the documented WaitForSingleObject Win32 API. However, beneath the surface, it triggers a deeper call to the NtWaitForSingleObject syscall, a critical component residing deep within the Windows kernel.
Analyzing User-Mode Code
In this section, we’ll delve into the process of dissecting user-mode code, a task made possible with the assistance of the IDA disassembler and debugger. Our objective is to comprehend how a seemingly simple user-mode application like the one we’ve created interacts with the Windows kernel via syscalls.
- Opening the Executable with IDA: Let’s start by opening our program using IDA, a powerful tool known for breaking down and fixing software issues.
- Locating the Main Function: In IDA, we’ll look for the central part of our program, known as the main function. It’s where everything happens.
- Setting a Breakpoint: To understand the code better, we’ll put a pause button in our code, right where the
WaitForSingleObjectfunction is called. This pause lets us look at the code step by step.

With the pause button set, we begin the process of fixing problems in our program. When we get to this point in the code, the program stops nicely, giving us a chance to carefully check how it’s working inside.
As we look through the code, we find something interesting: we’re going further into the core of a library called kernelbase32.dll.
Our main goal is to get to the NtWaitForSingleObject thing hidden deep in the ntdll.dll library. This is an important part where the program goes from regular mode to a more complicated mode called kernel mode.
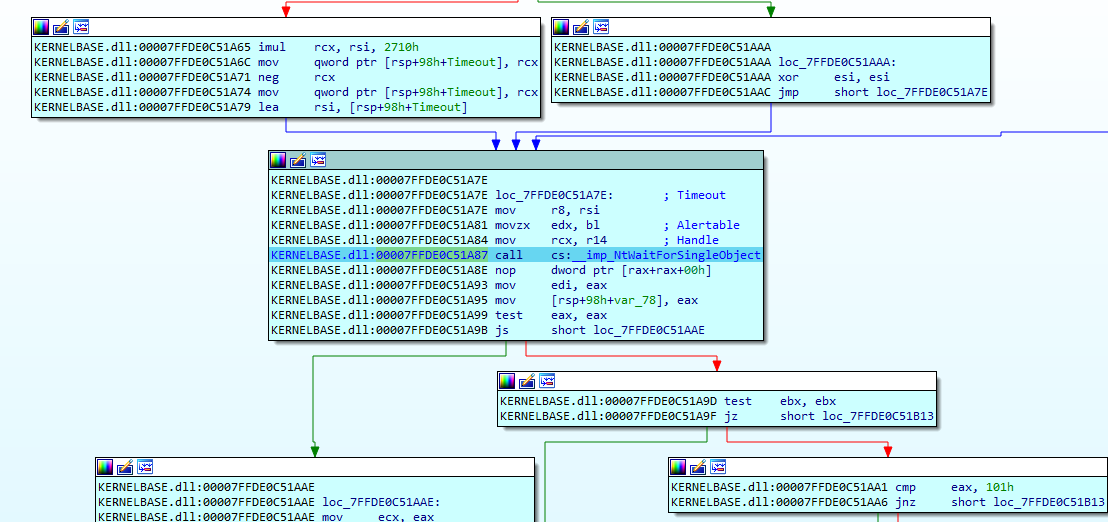
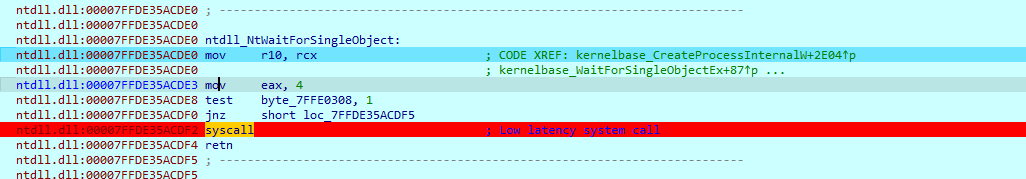
As shown in the code snippet above, we’ve finally reached an important part called the NtWaitForSingleObject function, tucked away safely inside the ntdll.dll library. When we get here, it’s like the program is about to make a big change and move into a more complicated mode called kernel mode.
Starting from this point, the way the code works goes through a big change as it goes deeper into kernel mode. In kernel mode, the Windows core takes over and manages everything, including important operations like syscalls, in this mysterious part of the computer’s operation.
1
2
3
4
5
6
7
8
ntdll.dll:00007FFDE35ACDE0 ntdll_NtWaitForSingleObject:
ntdll.dll:00007FFDE35ACDE0 mov     r10, rcx                        ; CODE XREF: kernelbase_CreateProcessInternalW+2E04↑p
ntdll.dll:00007FFDE35ACDE0                                         ; kernelbase_WaitForSingleObjectEx+87↑p ...
ntdll.dll:00007FFDE35ACDE3 mov     eax, 4
ntdll.dll:00007FFDE35ACDE8 test    byte_7FFE0308, 1
ntdll.dll:00007FFDE35ACDF0 jnz     short loc_7FFDE35ACDF5
ntdll.dll:00007FFDE35ACDF2 syscall                                 ; Low latency system call
ntdll.dll:00007FFDE35ACDF4 retn
As we figure out how things work in user mode, we’re getting ready for the next step: kernel debugging with WinDbg. Come along as we start this exciting adventure of learning and discovery.
Kernel-Side
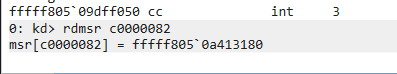
Now, as we attach the kernel debugger to our guest OS, our goal is to locate the exact spot within the kernel where the syscall instruction leads us. For this, we’ll be focusing on the IA32_LSTAR MSR (Model-Specific Register), specifically at memory address C0000082h.
WinDbg provides us with the means to retrieve this address:
1
rdmsr C0000082h
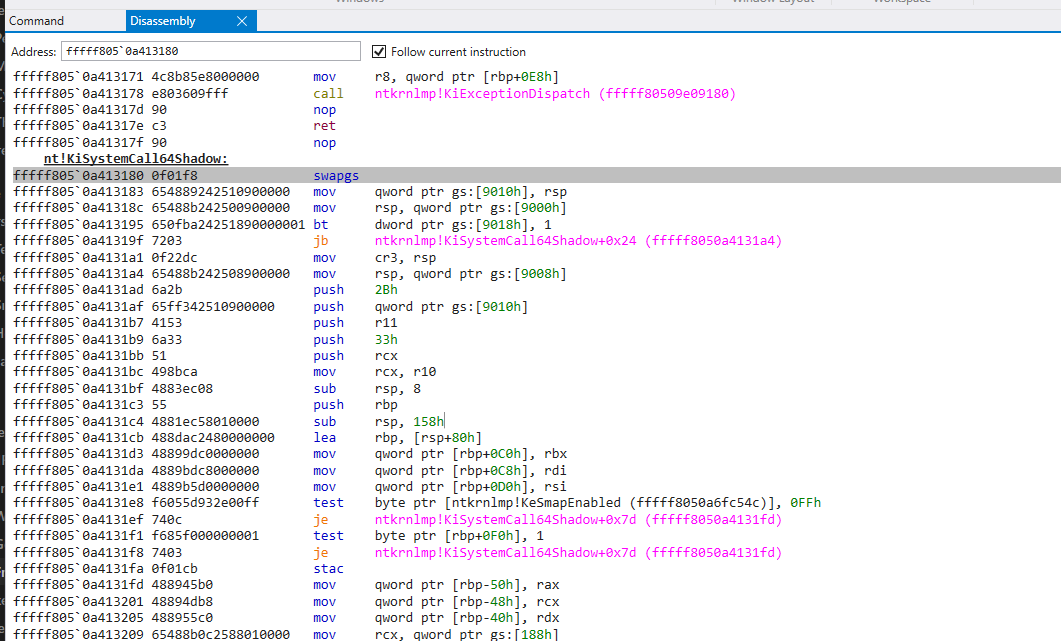
Executing this command will yield an address. If we copy and paste it into the disassembly window in WinDbg, we’ll be precisely where the kernel begins to process the syscall instruction from the user mode:
1
2
3
4
5
6
7
8
9
10
11
12
13
14
15
16
17
18
19
20
21
22
23
24
25
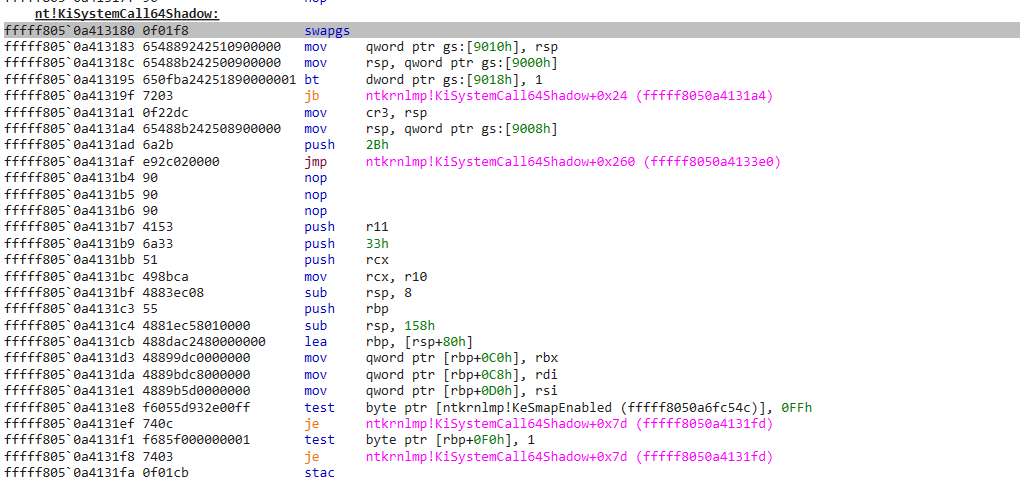
nt!KiSystemCall64Shadow:
fffff8050a413180 0f01f8 swapgs
fffff8050a413183 654889242510900000 mov qword ptr gs:[9010h], rsp
fffff8050a41318c 65488b242500900000 mov rsp, qword ptr gs:[9000h]
fffff8050a413195 650fba24251890000001 bt dword ptr gs:[9018h], 1
fffff8050a41319f 7203 jb ntkrnlmp!KiSystemCall64Shadow+0x24 (fffff8050a4131a4)
fffff8050a4131a1 0f22dc mov cr3, rsp
fffff8050a4131a4 65488b242508900000 mov rsp, qword ptr gs:[9008h]
fffff8050a4131ad 6a2b push 2Bh
fffff8050a4131af 65ff342510900000 push qword ptr gs:[9010h]
fffff8050a4131b7 4153 push r11
fffff8050a4131b9 6a33 push 33h
fffff8050a4131bb 51 push rcx
fffff8050a4131bc 498bca mov rcx, r10
fffff8050a4131bf 4883ec08 sub rsp, 8
fffff8050a4131c3 55 push rbp
fffff8050a4131c4 4881ec58010000 sub rsp, 158h
fffff8050a4131cb 488dac2480000000 lea rbp, [rsp+80h]
fffff8050a4131d3 48899dc0000000 mov qword ptr [rbp+0C0h], rbx
fffff8050a4131da 4889bdc8000000 mov qword ptr [rbp+0C8h], rdi
fffff8050a4131e1 4889b5d0000000 mov qword ptr [rbp+0D0h], rsi
fffff8050a4131e8 f6055d932e00ff test byte ptr [ntkrnlmp!KeSmapEnabled (fffff8050a6fc54c)], 0FFh
fffff8050a4131ef 740c je ntkrnlmp!KiSystemCall64Shadow+0x7d (fffff8050a4131fd)
fffff8050a4131f1 f685f000000001 test byte ptr [rbp+0F0h], 1
fffff8050a4131f8 7403 je ntkrnlmp!KiSystemCall64Shadow+0x7d (fffff8050a4131fd)
This is technically the entry point where we should place our kernel breakpoint. However, there are some nuances to consider.
First Issue
Placing a kernel mode breakpoint on any of the following instructions is technically possible:
1
2
3
4
5
6
7
8
9
nt!KiSystemCall64Shadow:

fffff8050a413180 0f01f8               swapgs
fffff8050a413183 654889242510900000   mov     qword ptr gs:[9010h], rsp
fffff8050a41318c 65488b242500900000   mov     rsp, qword ptr gs:[9000h]
fffff8050a413195 650fba24251890000001 bt      dword ptr gs:[9018h], 1
fffff8050a41319f 7203                 jb      ntkrnlmp!KiSystemCall64Shadow+0x24 (fffff8050a4131a4)
fffff8050a4131a1 0f22dc               mov     cr3, rsp
fffff8050a4131a4 65488b242508900000   mov     rsp, qword ptr gs:[9008h]
However, if we run the guest OS while the critical entry point is still in this state, it will either crash or hang. This occurs because the GS segment register and the kernel stack in RSP are not yet properly set up at this stage. The kernel debugging engine relies on these registers for its operations, and breaking at any of these locations would lead to a BSOD(Blue Screen Of Death).
The GS register is crucial in the 64-bit Windows kernel, as it stores a pointer to the internal KPCR struct. Kernel code cannot function without it.
The reason kernel code crashes without a correctly configured RSP register, pointing to a kernel stack, is due to the CPU feature called “Supervisor-Mode Access Prevention,” or SMAP. SMAP raises an exception if kernel code attempts to read or write from a user-mode memory, such as when the RSP register still points to a user-mode stack after the syscall instruction.
To work around this limitation, we need to place a breakpoint just after this code block, for instance, on any of the following instructions:
1
2
3
4
5
6
7
8
9
fffff8050a4131ad 6a2b                 push    2Bh
fffff8050a4131af 65ff342510900000     push    qword ptr gs:[9010h]
fffff8050a4131b7 4153                 push    r11
fffff8050a4131b9 6a33                 push    33h
fffff8050a4131bb 51                   push    rcx
fffff8050a4131bc 498bca               mov     rcx, r10
fffff8050a4131bf 4883ec08             sub     rsp, 8
fffff8050a4131c3 55                   push    rbp
....
The first push instruction is a suitable candidate.
Second Issue
The second, more complex challenge is that the KiSystemCall64Shadow service routine serves as the entry point into the kernel for all Win32 APIs called by the threads within the processes running in the guest OS. And believe us, that’s quite a multitude of calls!
So how do we isolate the specific syscall we’re interested in, amidst this bustling sea of calls?
One might suggest employing a conditional breakpoint, which is a great idea in general. However, in this highly active part of the system, a conditional breakpoint could bring the guest OS to a standstill.
This occurs because WinDbg uses a JavaScript engine to evaluate conditional breakpoints, which makes it orders of magnitude slower than the normal code flow within the syscall service routine.
Hence, we need an alternative approach to set a conditional breakpoint. My preferred method is a kernel binary patch in memory. But before we dive into that, let’s prepare our user-mode code.
Preparing User-Mode Code using Ntdll.dll
Take a look at the declaration of the NtWaitForSingleObject function:
1
2
3
4
5
NTSTATUS NtWaitForSingleObject(
	[in] HANDLE         Handle,
	[in] BOOLEAN        Alertable,
	[in] PLARGE_INTEGER Timeout
);
We can leverage the third parameter, a pointer to the PLARGE_INTEGER struct, to pass a specially crafted pointer, say 0x11224455, which should be relatively rare in typical use cases.
We can construct this pointer using the VirtualAllocEx function, which allows us to request a specific virtual address as its second parameter. Therefore, we can adjust our initial test code like this:
1
2
3
4
5
6
7
8
9
10
11
12
13
14
15
16
17
18
19
20
21
22
23
24
25
26
27
28
29
30
31
32
33
34
35
36
37
38
#include <iostream>
#include <Windows.h>

#pragma comment(lib, "ntdll.lib")

extern "C" {
	NTSTATUS NtWaitForSingleObject(
		HANDLE         Handle,
		BOOLEAN        Alertable,
		PLARGE_INTEGER Timeout
	);
}

int main()
{
    HANDLE h = CreateEvent(NULL, FALSE, FALSE, NULL);

	LPVOID pAddr = VirtualAllocEx(GetCurrentProcess(),
		(LPVOID)0x11224455,         // Request a specific address
		0x10000,                    // Reserve 1 page of memory
		MEM_COMMIT | MEM_RESERVE,   // Make it ready for use
		PAGE_READWRITE);            // Allow reading and writing
	if (!pAddr)
	{
		wprintf(L"ERROR: %d - VirtualAllocEx 2\n", GetLastError());
		goto RETURN;
	}

	// Because VirtualAllocEx rounds down the address, adjust it to 0x11224455
	(size_t&)pAddr |= 0x4455;

	NtWaitForSingleObject(h, FALSE, (PLARGE_INTEGER)pAddr);

	VirtualFreeEx(GetCurrentProcess(), pAddr, 0, MEM_RELEASE);

RETURN:
	CloseHandle(h);
}
Please be aware that the system memory manager may not necessarily comply with our request for a specific address. Therefore, it is advisable to refrain from utilizing this in production code. Nonetheless, it effectively fulfills our intended objective.
The preceding code may not offer significant utility within a production environment. Its primary objective revolves around transmitting the special value 0x11224455 to the kernel.
Implementing a Kernel Trap
Now, let’s delve into the implementation of a kernel trap. In this section, we will set up a trap to intercept specific conditions within the kernel service routine for a syscall. This allows us to gain control over the kernel’s execution at critical points.
To construct our trap effectively, it’s crucial to understand the conditions we want to capture. In our case, we want to detect when the RAX register holds the value 4. This is significant because RAX is the register used to convey the “system service number” in Windows, and 4 corresponds to the NtWaitForSingleObject function.
Additionally, we are interested in the R8 register, which is employed to pass the third input parameter according to the x64 calling convention for Windows. Specifically, we want to check if R8 contains the value 0x11224455 according to the x64 calling convention for Windows.
Let’s assemble the trap code that will help us capture these conditions:
1
2
3
4
5
6
7
8
cmp     rax, 4h       ; Check if RAX is equal to 4
jne     lb_continue   ; If not, continue execution
cmp     r8, 11224455h ; Check if R8 is equal to 0x11224455
jne     lb_continue   ; If not, continue execution

nop                  ; Place breakpoint here

lb_continue:
In this code, we first compare the value in RAX to 4 and R8 to 0x11224455. If both comparisons are successful, we execute a nop instruction, serving as a placeholder for our breakpoint. If the conditions are not met, execution continues without interruption.
In there we check for the condition that we outlined above, and if it is met, we provide a nop instruction to place our kernel breakpoint on. This will be analogous to a conditional breakpoint but with much less overhead.
Then we will also need to jump into our trap from the start of the KiSystemCall64Shadow service routine by replacing one of the original instructions:
1
2
fffff8050a4131ad 6a2b                 push    2Bh
fffff8050a4131af 65ff342510900000     push    qword ptr gs:[9010h]
The size of a jmp instruction is 5 bytes, thus we can’t use the first push 2Bh instruction for that. So let’s use the push qword ptr gs:[9010h] instruction instead.
Now we should can locate manually the “free space” at the end of the KiSystemCall64Shadow function using the kernel debugger. Simply look for the padding 00’s or CC’s at the end of the function body. This padding is usually placed there by the compiler to optimize the code flow.
1
2
3
4
5
6
fffff8050a4133de 0000               add     byte ptr [rax], al
fffff8050a4133e0 0000               add     byte ptr [rax], al
fffff8050a4133e2 0000               add     byte ptr [rax], al
fffff8050a4133e4 0000               add     byte ptr [rax], al
fffff8050a4133e6 0000               add     byte ptr [rax], al
...
Great, we’ve located the address we need. Next, let’s prepare our assembly code and proceed to patch the required addresses.
We’ll use this online x86 assembler tool to create our assembly instructions.
First, we need to determine the size of the memory space and then construct an appropriate jump instruction.
For example, let’s consider the instruction 65ff342510900000, which pushes a qword from the gs:[9010h] address. As a reminder, we intend to replace this instruction. It occupies 8 bytes, while our jump instruction is only 5 bytes long, so we’ll need to fill the remaining 3 bytes with NOP instructions.
1
2
3
4
0:  e9 00 00 00 00          jmp    0x5
5:  90                      nop
6:  90                      nop
7:  90                      nop
Now, let’s address the missing piece of our jump instruction – the destination address.
To calculate this destination address, we start with our current instruction at fffff8050a4131af and intend to jump to fffff8050a4133de.
By subtracting the source from the destination, we find that we need to jump 0x231 bytes ahead. (fffff8050a4133e0 - fffff8050a4131af = 0x231 )
With this calculation in mind, we can proceed to modify our assembly code accordingly.
1
2
3
4
0:  e9 2c 02 00 00          jmp    0x231
5:  90                      nop
6:  90                      nop
7:  90                      nop

We can use WinDbg to make the memory patch that I showed above by using the eb command: eb fffff8050a4131af e9 2C 02 00 00 90 90 90
Thus our original KiSystemCall64Shadow service routine becomes this, after the patch:
1
2
3
4
5
6
7
8
9
10
11
12
13
14
15
16
17
18
19
20
21
22
23
nt!KiSystemCall64Shadow:

fffff8050a413180 0f01f8               swapgs
fffff8050a413183 654889242510900000   mov     qword ptr gs:[9010h], rsp
fffff8050a41318c 65488b242500900000   mov     rsp, qword ptr gs:[9000h]
fffff8050a413195 650fba24251890000001 bt      dword ptr gs:[9018h], 1
fffff8050a41319f 7203                 jb      ntkrnlmp!KiSystemCall64Shadow+0x24 (fffff8050a4131a4)
fffff8050a4131a1 0f22dc               mov     cr3, rsp
fffff8050a4131a4 65488b242508900000   mov     rsp, qword ptr gs:[9008h]
fffff8050a4131ad 6a2b                 push    2Bh

; Our binary patch to jump our trap
fffff8050a4131af e92c020000           jmp     ntkrnlmp!KiSystemCall64Shadow+0x260 (fffff8050a4133e0)
fffff8050a4131b4 90                   nop
fffff8050a4131b5 90                   nop
fffff8050a4131b6 90                   nop

fffff8050a4131b7 4153                 push    r11
fffff8050a4131b9 6a33                 push    33h
fffff8050a4131bb 51                   push    rcx
fffff8050a4131bc 498bca               mov     rcx, r10
fffff8050a4131bf 4883ec08             sub     rsp, 8
fffff8050a4131c3 55                   push    rbp
Now lets patch memory we specified at the beginning which is fffff8050a4133de . But first we need to create our trap.
Here is our basic assembly trap.
1
2
3
4
5
6
7
8
9
10
11
cmp    rax, 0x4     ; Compare the value in the RAX register to 4
jne    lb_no        ; Jump to "lb_no" label if not equal (i.e., if RAX is not 4)

cmp    r8, 0x11224455 ; Compare the value in the R8 register to 0x11224455
jne    lb_no         ; Jump to "lb_no" label if not equal (i.e., if R8 is not 0x11224455)

nop                ; No operation (a placeholder for a breakpoint)

lb_no:             ; Label "lb_no" marks the location where execution continues if the comparisons fail
push   QWORD PTR gs:[0x9010] ; Push the value stored in memory at address gs:0x9010 onto the stack
jmp    000000      ; Unconditional jump to address 000000 (a placeholder for the actual jump target)
cmp rax, 0x4: This instruction compares the value in the RAX register to the constant value 4. If RAX is equal to 4, the Zero Flag (ZF) is set.jne lb_no: This is a conditional jump instruction. If the Zero Flag (ZF) is not set, indicating that the previous comparison did not result in equality (i.e., RAX is not 4), the program jumps to the “lb_no” label. If the comparison succeeds (RAX is 4), it continues to the next instruction.cmp r8, 0x11224455: Similar to the first comparison, this instruction compares the value in the R8 register to the constant value 0x11224455. If R8 is equal to 0x11224455, the Zero Flag (ZF) is set.jne lb_no: Another conditional jump instruction checks the Zero Flag (ZF). If it’s not set (i.e., R8 is not 0x11224455), the program jumps to the “lb_no” label. Otherwise, it proceeds to the next instruction.nop: This instruction is a no-op or “nop.” It doesn’t perform any operation but serves as a placeholder for a breakpoint. When debugging, you can replace this nop with an actual breakpoint to halt execution for analysis.lb_no:: This label defines a location in the code where execution continues if either of the previous comparisons fails (i.e., if RAX is not 4 or if R8 is not 0x11224455).push QWORD PTR gs:[0x9010]: This instruction pushes the 64-bit value stored in memory at the address gs:0x9010 onto the stack. It’s common in low-level code to use memory addresses for various purposes.jmp 000000: This is an unconditional jump instruction. It jumps to the address 000000, which is a placeholder for the actual jump target. In practice, this would be replaced with the address of the code you want to execute next.
The code essentially checks if the values in RAX and R8 meet specific conditions and takes different actions accordingly. It also includes a breakpoint for debugging purposes.

1
2
3
4
5
6
7
8
9
0:  48 83 f8 04             cmp    rax,0x4
4:  75 0a                   jne    0x10
6:  49 81 f8 55 44 22 11    cmp    r8,0x11224455
d:  75 01                   jne    0x10
f:  90                      nop
10: 65 ff 34 25 10 90 00    push   QWORD PTR gs:0x9010
17: 00
18: e9 00 00 00 00          jmp    <address>
1d:
To determine the address to which we will redirect the program’s execution, we calculate it as follows:
fffff8050a4133e0 (starting position our assembly trap) + 1d (size of our assembly trap) = fffff8050a4133fd (end position of our assembly trap)
1
2
3
4
5
6
7
8
9
10
11
12
13
14
15
16
nt!KiSystemCall64Shadow:
fffff8050a413180 0f01f8               swapgs
fffff8050a413183 654889242510900000   mov     qword ptr gs:[9010h], rsp
fffff8050a41318c 65488b242500900000   mov     rsp, qword ptr gs:[9000h]
fffff8050a413195 650fba24251890000001 bt      dword ptr gs:[9018h], 1
fffff8050a41319f 7203                 jb      ntkrnlmp!KiSystemCall64Shadow+0x24 (fffff8050a4131a4)
fffff8050a4131a1 0f22dc               mov     cr3, rsp
fffff8050a4131a4 65488b242508900000   mov     rsp, qword ptr gs:[9008h]
fffff8050a4131ad 6a2b                 push    2Bh
fffff8050a4131af e92c020000           jmp     ntkrnlmp!KiSystemCall64Shadow+0x260 (fffff8050a4133e0)
fffff8050a4131b4 90                   nop
fffff8050a4131b5 90                   nop
fffff8050a4131b6 90                   nop
fffff8050a4131b7 4153                 push    r11   // Our assembly trap will jump to here
fffff8050a4131b9 6a33                 push    33h
fffff8050a4131bb 51                   push    rcx
We’ll transition from the current location, fffff8050a4133fd (the address where our assembly trap is), to the destination point, fffff8050a4131b7 (where the normal code flow resumes).
0a4131b7 - 0a4133fd = fffffffffffffdba, a negative value that allows us to navigate to the desired address, equivalent to -582 in decimal.
Given that our instruction operates within a 32-bit address range, we’ll abbreviate fffffffffffffdba as fffffdba.
This refinement results in our updated assembly code:
1
2
3
4
5
6
7
8
9
0:  48 83 f8 04             cmp    rax,0x4
4:  75 0a                   jne    0x10
6:  49 81 f8 55 44 22 11    cmp    r8,0x11224455
d:  75 01                   jne    0x10
f:  90                      nop
10: 65 ff 34 25 10 90 00    push   QWORD PTR gs:0x9010
17: 00
18: e9 ba fd ff ff          jmp    0xfffffdba
1d:
We can use the following WinDbg command to write the machine code for our trap: eb fffff8050a4133e0 48 83 f8 04 75 0a 49 81 f8 55 44 22 11 75 01 90 65 ff 34 25 10 90 00 00 e9 BA FD FF FF
The most recent iteration of our trap code appears as follows:
1
2
3
4
5
6
7
8
9
10
11
12
13
14
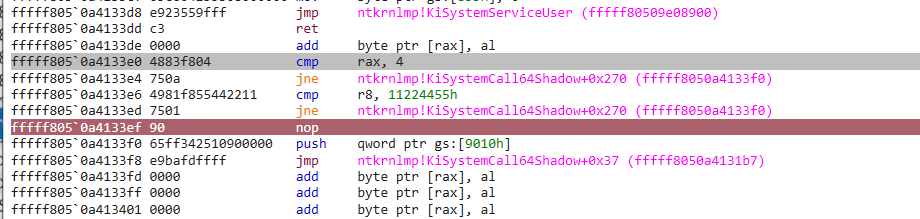
fffff8050a4133de 0000 add byte ptr [rax], al
fffff8050a4133e0 4883f804 add byte ptr [rax], al
fffff8050a4133e4 750a jne ntkrnlmp!KiSystemCall64Shadow+0x270 (fffff8050a4133f0)
fffff8050a4133e6 4981f855442211 cmp r8, 11224455h
fffff8050a4133ed 7501 jne ntkrnlmp!KiSystemCall64Shadow+0x270 (fffff8050a4133f0)
fffff8050a4133ef 90 nop ; Put breakpoint here
fffff8050a4133f0 65ff342510900000 push qword ptr gs:[9010h]
fffff8050a4133f8 e9bafdffff jmp ntkrnlmp!KiSystemCall64Shadow+0x37 (fffff8050a4131b7)
fffff8050a4133fd 0000 add byte ptr [rax], al
fffff8050a4133ff 0000 add byte ptr [rax], al
fffff8050a413401 0000 add byte ptr [rax], al
fffff8050a413403 0000 add byte ptr [rax], al
fffff8050a413405 0000 add byte ptr [rax], al
fffff8050a413407 0000 add byte ptr [rax], al
Finally, place the breakpoint at the fffff8050a4133ef address (in case of our patch) with the bp command in WinDbg: bp fffff8050a4133ef
Optionally, you can place a hardware execution breakpoint on that instruction using the ba command:
ba e 1 fffff8050a4133ef
After that let the guest OS run and step into the syscall from the NtWaitForSingleObject user-mode function. This should trigger the breakpoint in the kernel.
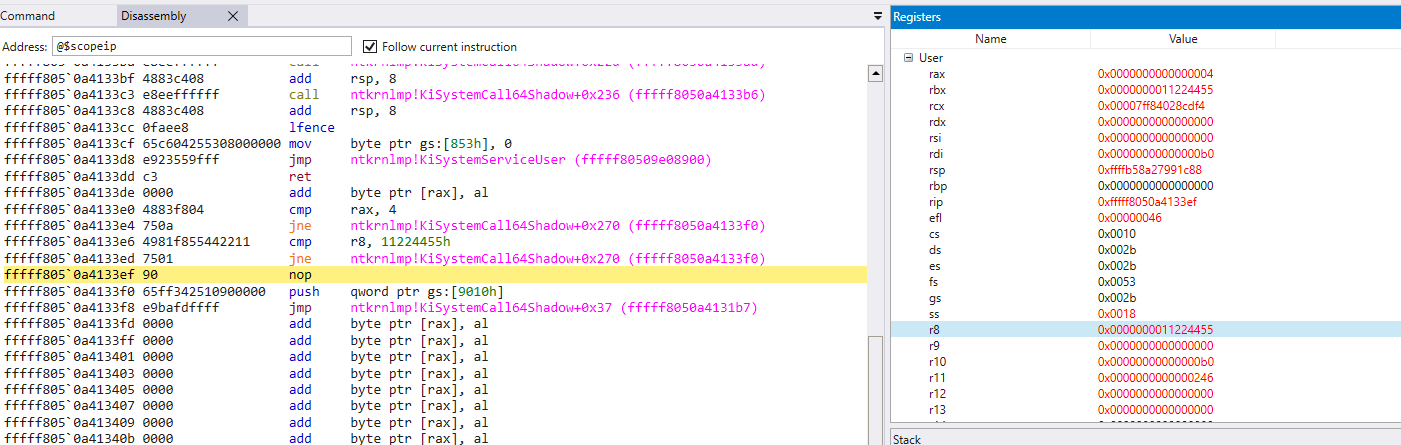
Now we hit the breakpoint earlier we set. Which means we succcesfully set a conditional breakpoint on kernel with assembly and debugged our NtWaitForSingleObject program on directly syscall.
Now lets put breakpoint on KiSystemServiceUser function and run debugger again.
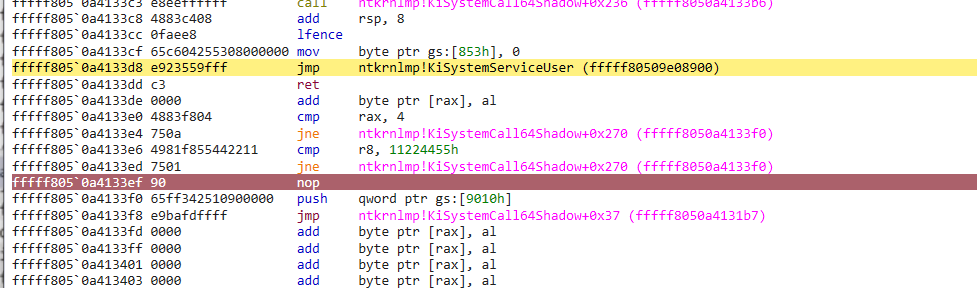
After the breakpoint is triggered, you’ll encounter another instruction within the KiSystemServiceUser function, namely call rax. This is where the actual kernel functions commence. It’s noteworthy that the address stored in the rax register at this point corresponds to the specific kernel function being executed.

After step into the call rax. You can analyze kernel freely.
Then continue stepping through the kernel code to do your further research.